 We test RavenDB as thoroughly as we can. Beyond just tests, longevity runs, load test and in general beating it with a stick and seeing if it bleats, we also routinely push early build of RavenDB to our own production systems to see how it behaves on real load.
This has been invaluable in catching several hard to detect bugs. A few days after we pushed a new build to production, we started getting errors about running out of disk space. The admin looked, and it seemed to have fixed itself. Then it repeated the issue.
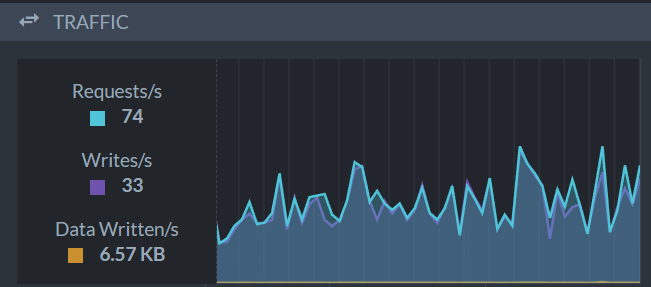
It took a bit of time to figure out what was going on. A recent change caused RavenDB to hang on to what are supposed to be transient files until an idle moment. Where idle moment is defined as 5 seconds without any writes. Our production systems don’t have an idle moment, here is a typical load on our production system:
We’ll range between lows of high 30s requests per seconds to peeks of 200+ requests per second.
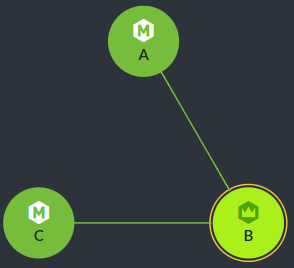
So we never have an idle moment to actually clean up those files, so they gather up. Eventually, we run out of disk space. At this point, several interesting things happen. Here is what our topology looks like:
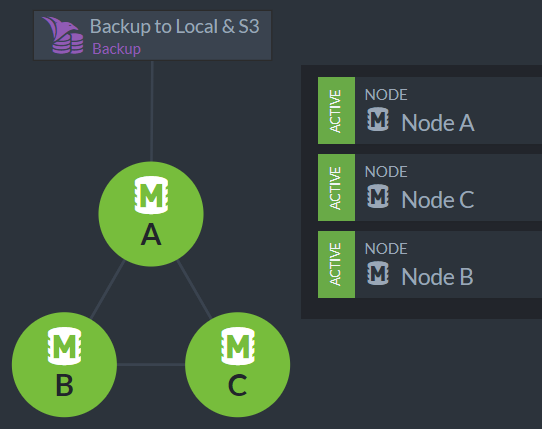
We have three nodes in the cluster, and currently, node B is the leader of the cluster as a whole. Most of our operations relate to a single database, and for that database, we have the following topology:
Note that in RavenDB, the cluster as a whole and a particular database may have different topologies. In particular, the primary node for the database and the leader of the cluster can and are often different. In this case, Node A is the primary for the database and node B is the leader of the cluster.
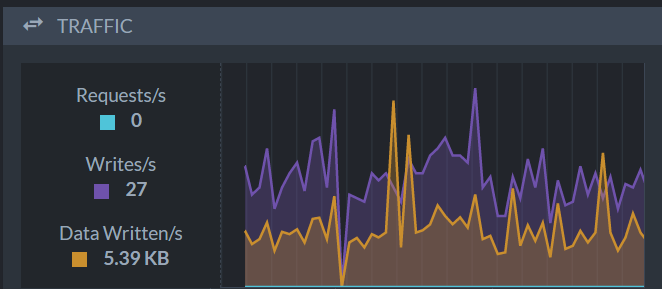
Under this scenario, we have Node A accepting all the writes for this database, and then replicating the data to the other nodes. Here is what this looks like for node C.
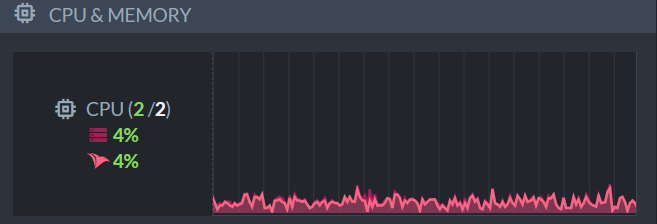
In other words, Node A is very busy handling requests and writes. Node C is just handling replicated writes. Just for reference, here is what Node A’s CPU looks like, the one that is busy:
In other words, it is busy handling requests. But it isn’t actually busy. We got a lot of spare capacity at hand.
This make sense, our benchmark scenarios is starting with tens of thousands of requests per seconds. A measly few hundreds per second aren’t actually meaningful load. The servers in questions, by the way, are t2.large with 2 cores and 8GB of RAM.
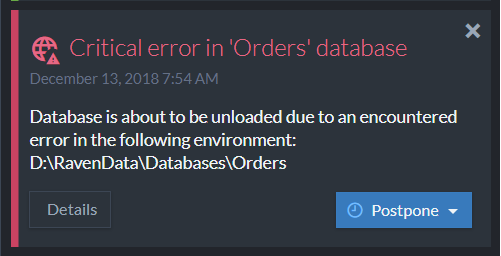
So we have a bug in releasing files when we aren’t “idle”. The files just pile up and eventually we run out of disk space. Here is what this looks like in the studio:
And clicking on details gives us:
So this looks bad, but let’s us see how this actually turns out to work in practice.
We have a failure on one node, which causes the database to be unloaded. RavenDB is meant to run in an environment where failure is likely and is built to handle that. Both clients and the cluster as a whole know that when such things happen, either to the whole node or to one particular database on it, we should respond accordingly.
The clients automatically fail over to a secondary node. In the case of the database in question, we can see that if Node A is failure, the next in like would be Node C. The cluster will also detect that are re-arrange the responsibilities of the nodes to indicate that one of them failed.
The node on which the database has failed will attempt to recover from the error. At this point, the database is idle, in the sense that it doesn’t process any requests, and will be able to cleanup all the files and delete them. In other words, the database goes down, restarts and recover.
Because of the different write patterns on the different nodes, we’ll run into the out of disk space error at different times. We have been running in this mode for a few days now. The actual problem, by the way, has been identified and resolved. We just aren’t any kind of pressure to push the fix to production.
Even under constant load, the only way we can detect this problem is through the secondary affects, the disk space on the machines that is being monitored. None of our production systems has reported any failures and monitoring is great across the board. This is a great testament to the manner in which expecting failure and preparing for it at all levels of the stack really pays off.
My production database is routinely running out of space? No worries, I’ll fix that on the regular schedule, nothing is actually externally visible.
